The Histogram displays a visual representation of all of the pixels values in an image, plotted from black on the left to white on the right; the height of the column shows how many pixels in the image have that value. The values are measured in 16 bit and are displayed as a percentage (between 0-100%). The Histogram can be an essential tool for managing the dynamic range of an image so that you can be sure you aren’t pushing important details in an image’s highlights or shadow areas to pure white or black without detail.
The histogram will vary from image to image:
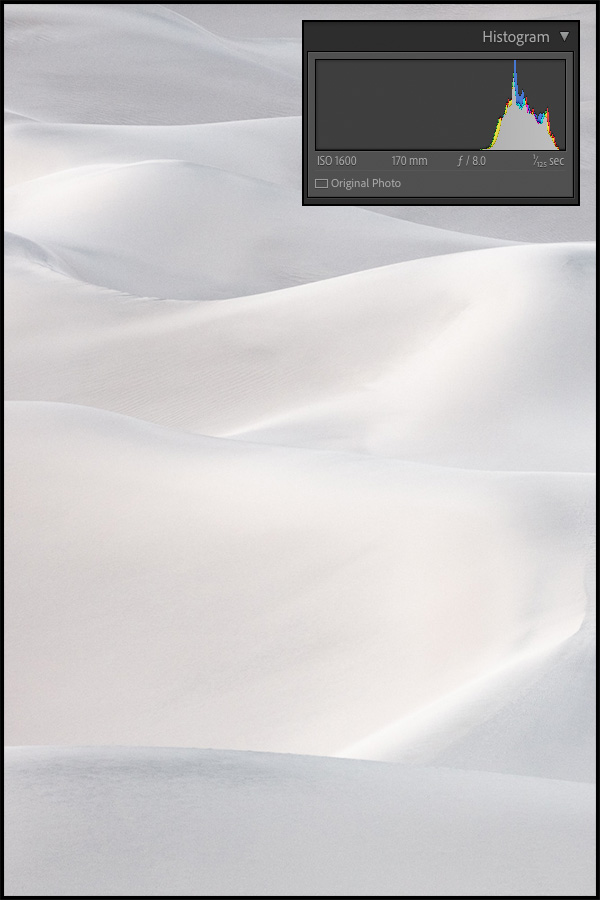
• If you have a high-key image (white sand dunes, for example), most of the columns in the histogram will fall on the right side.
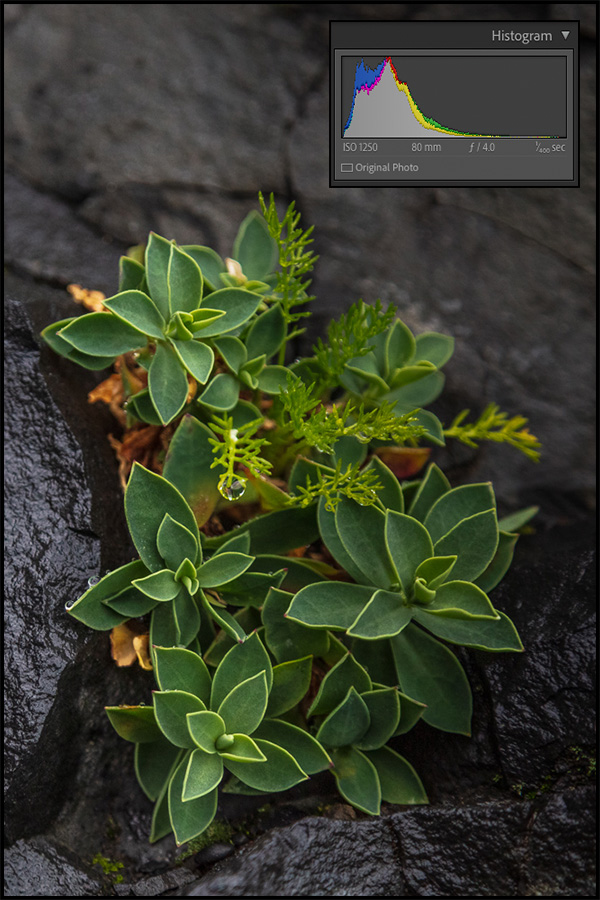
• If you have a low-key image (leaves in shadow on dark rocks for example), then most of the columns in the histogram will fall on the left side.
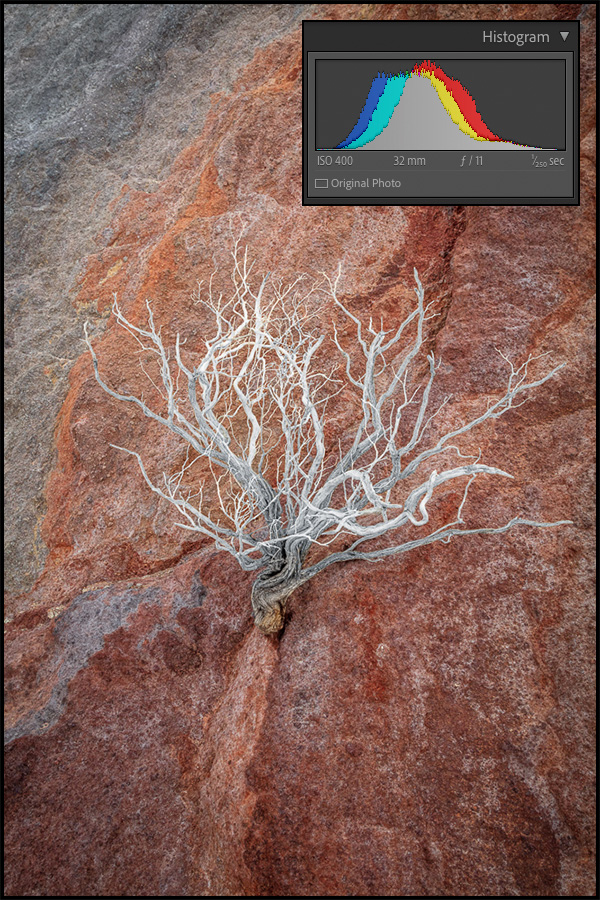
• There is no such thing as a perfect histogram; each histogram will depend on the content of the image.
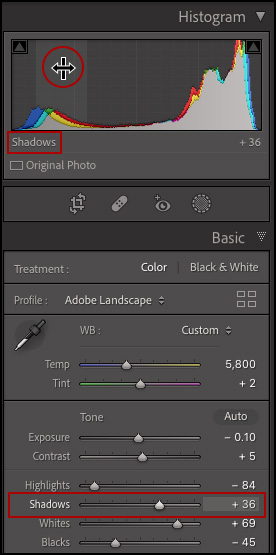
Changing Values using the Histogram — In addition to using the Exposure, Highlights, Shadows, Whites and Blacks sliders in the Basic panel to move the values in the image, you can drag directly in the Histogram to change the values. Depending on where you click and drag in the Histogram, Lightroom Classic will move the appropriate Tone slider (Blacks, Shadows, Exposure, Highlights, and/or Whites).
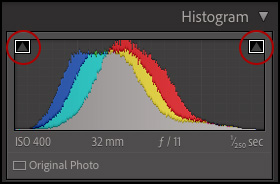
Clipping Warnings — Positioning the cursor over the shadow/highlight clipping icons (the triangles in the upper left/right of the Histogram panel), will display a blue overlay where information in one or more of the red, green, and/or blue channels is pure black (0) and a red overlay will appear where information in one or more of the red, green, and/or blue channels is pure white (255). Clicking either warning icon will toggle the red/blue overlay. Or, tap the “J” key to toggle the visibility of both clipping previews at once.
• To preview individual channel clipping, Option-drag (Mac) | Alt -drag (Win) the Blacks/Whites sliders in the Basic panel. Where the image preview is pure black or white, all of the channels are clipped. The various colors represent clipping on a per-channel (or combination of channels) basis.
This video (Shadow and Highlight Clipping Warning in Lightroom), shows the clipping warnings in action.
LAB Color — To view the LAB color values of an image (instead of the RGB values), right -click (or Control -click on Mac) within the Histogram (in the Develop module) and choose Show Lab Color Values.
Soft Proofing — With Soft Proofing enabled, the histogram displays 8 bit values from 0-255.
Note: It’s important to remember that when you use the light meter in your camera to make an exposure, most cameras are (by default) programed to take the values measured and set them in the middle of the histogram. For that reason, if you photograph bright white clouds or ice fields, those bright values will be recorded as middle grey. In order to make the images look like bright clouds or ice, those values would need to be increased in post-process. Unfortunately, doing this amplifies the noise in the originally underexposed areas of the image as their values are lightened. In this case, it’s better to manually override the camera during capture (by increasing the exposure of the scene) to place the brighter values where they should fall on the histogram — recording the true tonality of the scene at time of capture.
Great work as usual… Thanks for sharing so much knowledge and tips over the years!
Thank you Carlos. : )