A histogram represents all of the pixel values in an image, plotted from 0 (black) on the left to 255 (white) on the right; the height of the column shows how many pixels in the image have that value.It can be an essential tool for managing the dynamic range of an image so that you can be sure you aren’t pushing important details in an image’s highlights or shadow areas to pure black or white without detail.
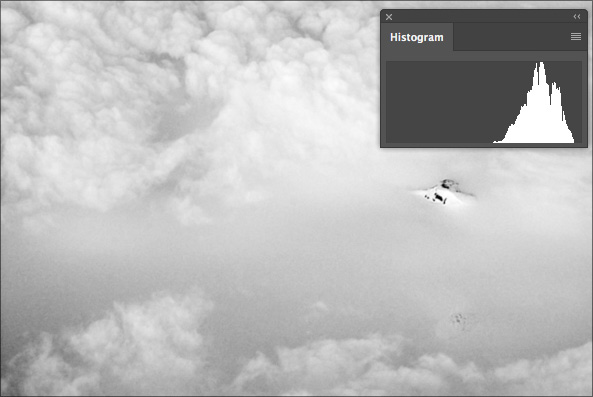
The histogram will vary from image to image. If you have a high-key image (white clouds, for example), most of the columns in the histogram will fall on the right side.
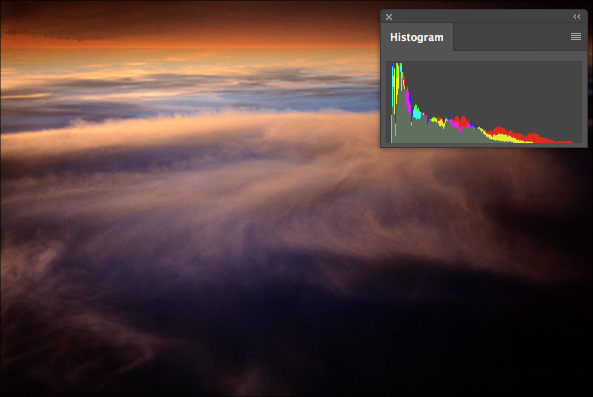
If you have a low-key image (such as the darkening sky at dusk), then most of the columns in the histogram will fall on the left side.
There is no such thing as a perfect histogram; each histogram will depend on the content of the image.
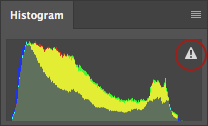
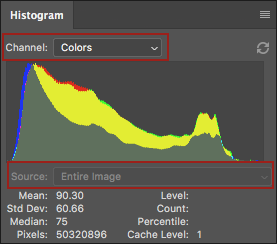
There are several different ways to customize the information displayed in the Histogram. If you see a warning icon (exclamation mark) in the Histogram panel, click to refresh the Histogram using the full image data (or use the fly-out menu to select Uncashed Refresh). Note: In other views (see below) the two, circular arrows icon can also be clicked to refresh the data.
In addition to viewing the Histogram in Compact view, use the fly-out menu to select Expanded View and choose to show/hide Statistics about the image. From the Channel menu, choose what data is displayed in the Histogram Panel (Colors, the Composite (RGB or CMYK for example), individual channels (Red, Green, Blue for example), or Luminosity). From the Source menu, choose to see data from the Entire Image, Selected Layer, or Adjustment Composite. Note: to select Selected Layer, the file must contain multiple layers and to select Adjustment Composite, the file must have an adjustment layer selected in the Layers panel.
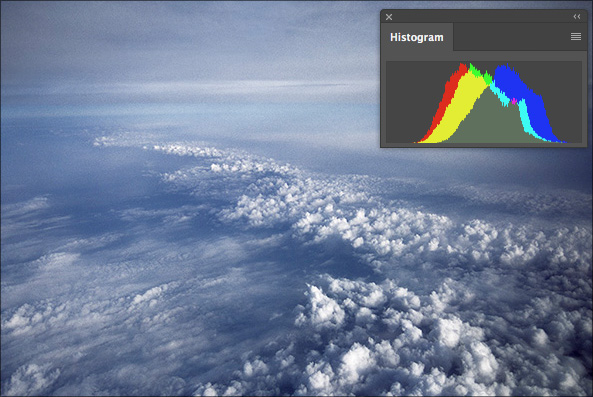
You an also use the fly-out menu to display All Channels and choose whether or not to see them in Color.
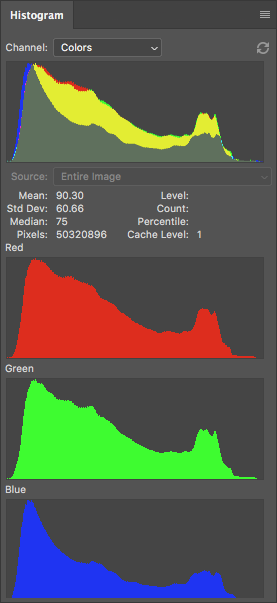
All Channels view (with channels displayed in color).
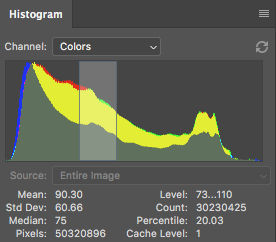
To interactively view the Level, Count, and Percentile of an area in the histogram, use the fly-out menu to enable Show Statistics and click-drag over the desired area in the Histogram Panel.
Note: It’s important to remember that when you use the light meter in your camera to make an exposure, the camera is directed to take the values measured and set them in the middle of the histogram. For that reason, if you photograph clouds or ice fields over the Greenland, those bright snowy values will be recorded as middle grey. In order to make the images look like bright clouds or snow, those values would need to be increased in post-process. Unfortunately, doing this amplifies the noise in the originally underexposed areas of the image as their values are increased. In this case, it’s better to manually override the camera during capture (by over exposing the scene) to place the brighter values where they should fall on the histogram—recording the true tonality of the scene at time of capture.
Nice explication